Superelevation in Roads: Design, Formula, Worked Example
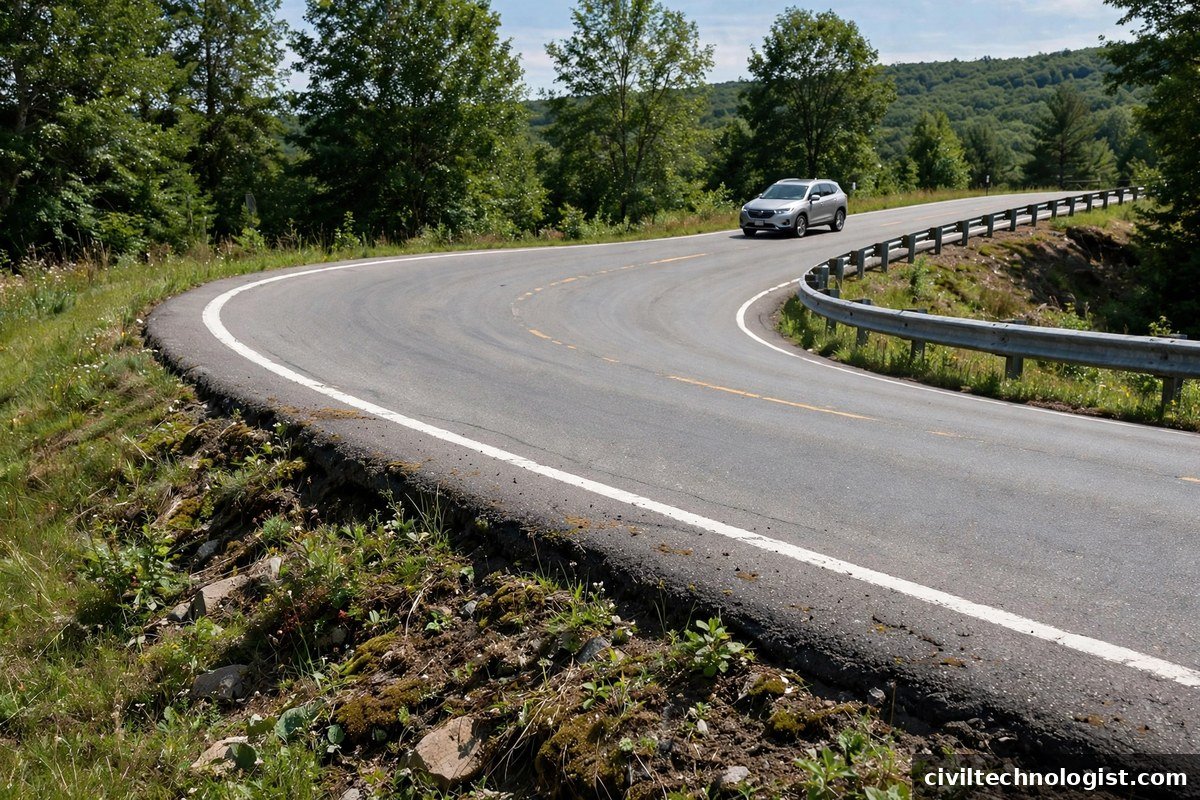
Take a curve a little too fast and you feel your car pushed toward the outside of the bend. That push is centrifugal force, and on a road curve it is countered by banking the pavement — raising the outer edge above the inner edge. That transverse slope is called superelevation (or cant), and it is one of the first things designed in highway geometric design. The banked profile is built through the pavement layers, including the base course.
This article explains the Superelevation in road design: the formula, the code limits, the transition length, and the complete design procedure with worked examples you can follow on any project. The limits in the tables below also vary by the types of roads the curve serves.
What Is Superelevation?
Superelevation is the inward transverse slope provided along the full length of a horizontal curve. By tilting the road surface toward the inside of the curve, part of the vehicle’s weight acts inward and balances the outward centrifugal force — which keeps vehicles from skidding outward or overturning.
The design is a balance of three things:
e + f = V² / (127R)
where:
- e = rate of superelevation (as a decimal — 0.07 means 7%)
- f = coefficient of lateral (side) friction between tyre and pavement (IRC uses 0.15 for design)
- V = design speed (km/h)
- R = radius of the horizontal curve (m)
The number 127 comes from unit conversion: V²/(gR) with V in km/h and g = 9.81 m/s² gives 127 in the denominator. If friction is assumed to take none of the load (f = 0), you get the equilibrium superelevation:
e = V² / (127R)
At equilibrium superelevation, the pressure on the inner and outer wheels is equal and friction is not called into play at all. In real design, friction always helps, so the provided superelevation is usually less than equilibrium.
Maximum Superelevation (IRC Limits)
Steeper banking is not always better. Slow-moving or heavily loaded vehicles on a very steep cross-slope can slide inward toward the centre of the curve. That is why IRC fixes maximum values:
The same curve does not get the same banking everywhere. IRC sets the maximum from the traffic that actually uses the road:
| Terrain / road type | Maximum superelevation (emax) | Why the limit is set there |
|---|---|---|
| Plain and rolling terrain | 7% (1 in 15) | Speeds are high and traffic is mixed — the cap is set by the slowest, heaviest vehicles, which a steeper slope would drag inward. |
| Hilly roads (not snow-bound) | 10% | Curves are sharper and design speeds are lower, so the curve needs more banking — but only where snow and ice do not make the slope slippery. |
| Snow-bound areas | 7% | Snow and ice make a steeper slope slippery, so the cap stays at 7%. |
| Urban roads with frequent intersections | 4% | Vehicles stop, turn and queue on the curve, so even a moderate slope would drag slow traffic inward. |
For reference, AASHTO (the US Green Book used internationally) allows emax values up to 12% in some regions, and Pakistan’s NHA General Specifications generally follow IRC limits for mixed-traffic roads. The values above are the ones that govern on Pakistani and Indian roads.
There is also a minimum: superelevation must never be less than the road camber — otherwise the curve would drain worse than a straight. So the provided superelevation is always at least the camber value.
Practical note: Camber is the cross-slope on straight sections (for drainage only), while superelevation is the cross-slope on curves (for safety). The two are connected: on a curve, the camber is first removed, then reversed into superelevation — the transition is covered in the section on transition length below.
Camber vs Superelevation
| Camber | Superelevation | |
|---|---|---|
| Purpose | Drain rainwater off the surface | Counteract centrifugal force on curves |
| Shape | Crown (both sides fall outward) or single slope | Single slope, outer edge raised |
| Where | Straight sections | Horizontal curves |
| Typical values (IRC) | 2.0% for bituminous/CC, 2.5% thin bituminous, 3% WBM/gravel, 4% earth | Up to 7% plain, 10% hilly, 4% urban |
Superelevation Table: Ready Values for Common Speeds
For quick reference, here are equilibrium values e = V²/(127R) and the mixed-traffic design values e = V²/(225R) for the speeds and radii you will meet most often on site. The ‘Provided’ column is what you actually build after applying the IRC maximum of 7% on plain terrain.
| Design speed (km/h) | Radius (m) | Equilibrium e | Mixed-traffic e (V²/225R) | Provided |
|---|---|---|---|---|
| 50 | 150 | 13.1% | 7.4% | 7% (capped) |
| 60 | 200 | 14.2% | 8.0% | 7% (capped) |
| 60 | 300 | 9.4% | 5.3% | 5.3% |
| 80 | 250 | 20.2% | 11.4% | 7% (capped) |
| 80 | 400 | 12.6% | 7.1% | 7% (capped) |
| 80 | 500 | 10.1% | 5.7% | 5.7% |
| 100 | 500 | 15.7% | 8.9% | 7% (capped) |
| 100 | 700 | 11.2% | 6.3% | 6.3% |
Reading the table: whenever the mixed-traffic value exceeds 7%, provide 7% and rely on friction for the rest — exactly as in Worked Example 1 below. On very flat curves the calculated e can fall below the camber; then just provide camber and no superelevation is needed.
IRC Design Procedure (Mixed Traffic)
Indian and Pakistani roads carry mixed traffic — bullock carts and trucks share the road with cars — so IRC does not design for equilibrium superelevation. It uses a reduced design speed: 75% of the design speed for the friction calculation, which is where the 225 in the denominator comes from (127 / 0.75² ≈ 225). Work in this order:
- Calculate e = V² / (225R) using the design speed V in km/h and radius R in metres.
- If e ≤ camber, provide camber — no extra superelevation needed.
- If camber < e ≤ emax, provide the calculated e.
- If e > emax, provide emax, then check the friction: f = V²/(127R) − e must be ≤ 0.15 (the IRC limit for lateral friction).
Worked Example 1 — Curve Exceeding the Maximum
Data: Design speed V = 80 km/h, curve radius R = 250 m, plain terrain, mixed traffic.
Step 1 — Calculate e: e = 80² / (225 × 250) = 6400 / 56250 = 0.1138 (11.38%)
Step 2 — Compare with emax: 11.38% > 7% (emax for plain terrain), so provide e = 0.07 (7%).
Step 3 — Friction check: f = V²/(127R) − e = 6400/(127 × 250) − 0.07 = 6400/31750 − 0.07 = 0.2016 − 0.07 = 0.1316
0.1316 ≤ 0.15, so the design is safe — friction covers the balance without exceeding the IRC limit.
What this means on site: for a 7.3 m wide carriageway, the outer edge is raised by 0.07 × 7.3 = 0.51 m above the inner edge, and that rise is developed gradually along the transition length — it is never built suddenly at the curve point.
For comparison: the same 80 km/h speed on a gentler 300 m radius gives equilibrium e = 16.8% and mixed-traffic e = 9.48%, so 7% is again provided — and the friction check is f = 0.098, also safe (≤ 0.15). Providing the full 16.8% there would have lifted the outer edge by 1.23 m — a slope no slow vehicle could use safely. The 0.51 m rise is the same in both cases, because both provide 7% on a 7.3 m carriageway, and it is developed over about 77 m on plain terrain.
Worked Example 2 — Curve Within the Maximum
Data: V = 60 km/h, R = 300 m, plain terrain, camber = 2.5%.
- e = 60² / (225 × 300) = 3600 / 67500 = 0.0533 (5.33%)
- 5.33% < 7% and > 2.5% camber → provide e = 5.33% (often rounded to 5.5% for construction).
- No friction check needed since e < emax.
Worked Example 3 — Urban Road with Low Maximum
Data: V = 50 km/h, R = 120 m, urban road with intersections, camber = 2.0%.
- e = 50² / (225 × 120) = 2500 / 27000 = 0.0926 (9.26%)
- Urban emax = 4% → provide e = 0.04 (4%).
- Friction check: f = 2500/(127 × 120) − 0.04 = 2500/15240 − 0.04 = 0.1640 − 0.04 = 0.124
- 0.124 ≤ 0.15 → safe, but note how tight the margin is. On urban curves, if the friction check fails, the only options are to increase the radius or lower the design speed — you cannot raise the superelevation above the urban maximum.
Transition Length and Superelevation Runoff
The full rise is never built at the curve point — it is developed gradually over a transition length on the approach. The length depends on the rate at which the outer edge is allowed to rise relative to the centreline:
| Terrain | Rate of introduction | Transition length formula |
|---|---|---|
| Plain / rolling | 1 in 150 | L = e × W × 150 |
| Built-up / urban | 1 in 100 | L = e × W × 100 |
| Hilly | 1 in 60 | L = e × W × 60 |
Worked: For Example 1 (e = 7%, carriageway W = 7.3 m, plain terrain):
Total outer-edge rise = 0.07 × 7.3 = 0.511 m. Transition length L = 0.511 × 150 = 76.7 m (say 77 m)
So the outer edge climbs half a metre over 77 m of approach — a gentle ramp the driver never notices, which is exactly the point. The same alignment is used for the road marking, so the markings follow the finished curve.
>
That distance is the runoff length — the same transition length worked out above. On the straight, the road has a crown (camber): both halves fall away from the centreline so rain runs off. On a curve that crown has to disappear — a crowned curve would tip vehicles outward. The cross-section changes in three stages:
- Normal camber: the crown is in place and both halves of the road fall outward to the edges.
- Crown removed: the outer half is flattened until the whole carriageway is level — a flat cross-section at the start of the transition.
- Slope reversed: the outer edge keeps rising until the full superelevation is reached at the start of the curve.
Build the rise over a shorter length and drivers feel it as a ramp — and a vehicle entering the curve is already being thrown outward before the banking can help it.
Practical note: A common site error is developing the rise too fast (short transition), which throws vehicles outward just before the curve — the opposite of what superelevation is for. Always set out the transition chainages from the drawings and check them with a level. When checking a superelevated curve with an auto level, measure the cross-fall at the centreline chainages marked on the drawings. If the achieved slope is short of design, the error shows up as a rough ride — and on high-speed curves, as a safety problem. Verify before the prime coat goes down, because fixing it after asphalting is expensive. Building the full rise too early is the same error in another form — it also throws vehicles outward before the curve.
Superelevation Practice in Pakistan (NHA)
On Pakistani highway projects, the NHA General Specifications govern, and project special provisions can tighten the IRC limits further. Two things matter most on site:
- Overloaded trucks are the norm, not the exception. Where slow, heavy vehicles dominate, do not push superelevation above the plain-terrain 7% — and on curves carrying a lot of slow traffic, consider staying below it.
- Drainage on curves deserves a separate check: with the crown removed, all rainwater runs to the inner edge. Make sure the inner-side drains and the longitudinal gradient can carry it — ponding on the inside of a superelevated curve is a built-in aquaplaning trap.
Design Steps on Site
When a curve reaches you on site, work in this order:
- Fix the design speed — from the drawings, or from the road class.
- Find the radius — from the drawings, or from the curve as set out on site.
- Calculate e — e = V²/(225R) for mixed traffic, and work out e = V²/(127R) as well so you know how much friction you are asking for.
- Check against the maximum — 7% plain, 10% hilly, 4% urban. If the calculated e is above the maximum, provide the maximum and check the friction (f ≤ 0.15).
- Provide the runoff — set out the transition length on the approach so the full superelevation is reached at the start of the curve, not after it.
Common Mistakes in Superelevation
Most superelevation trouble on site comes from three mistakes:
- Providing full superelevation on a sharp curve with slow traffic. A sharp curve with slow, heavy traffic does not need the full equilibrium value — and if you provide it, slow vehicles slide inward. Use the mixed-traffic formula and cap at emax.
- Ignoring the friction factor. Superelevation is only half the balance — e + f = V²/(127R). If you provide emax and never check f, you can end up asking the tyres for more friction than 0.15, which is unsafe in wet weather.
- Abrupt runoff. Building the full rise over too short a length — or starting it at the curve instead of on the approach — throws vehicles outward just when they need the banking most.
Frequently Asked Questions
What is the formula for superelevation?
The general relationship is e + f = V²/(127R), where e is the rate of superelevation, f is the coefficient of lateral friction, V is the design speed in km/h and R is the radius in metres. For mixed traffic, IRC uses the reduced form e = V²/(225R).
What is the maximum superelevation allowed by IRC?
7% on plain and rolling terrain, 10% on hilly roads (not snow-bound) and 4% on urban roads with frequent intersections. Snow-bound areas are capped at 7%.
What happens if the calculated superelevation exceeds the maximum?
Provide the maximum (emax), then check the friction: f = V²/(127R) − e must be ≤ 0.15. If it is not, increase the radius or lower the design speed.
Why not just provide equilibrium superelevation on every curve?
Because at low speeds — a truck crawling up a hill, a vehicle stopped on the curve — a steep slope drags vehicles inward. The IRC maximum protects the slowest traffic, and friction covers the rest at design speed.
What is the transition length in Superelevation in road design?
The length over which the outer edge is raised from normal camber to full superelevation. On plain terrain it is about 1 in 150 — for a 7.3 m carriageway at 7%, about 77 m. See the transition length section above.
What is the difference between camber and Superelevation in road construction?
Camber is the cross-slope on a straight, provided to drain rainwater. Superelevation in road curves is the inward slope on a horizontal curve, provided to counteract centrifugal force.
Can superelevation be negative?
Effectively yes — that is called adverse camber, where the outer edge is lower than the inner edge. It happens on curves that are superelevated in the wrong direction, or where the crown is left in place, and it is dangerous because it adds to the centrifugal force instead of countering it.
How is Superelevation checked on site?
With an auto level at the transition chainages, measuring the cross-fall at the centreline. The achieved slope is compared with the design superelevation at each chainage.
Why is Superelevation in road design limited to 7% on plains?
Because steeper banking would drag slow, heavily loaded vehicles inward toward the centre of the curve. The 7% cap is set by the slowest traffic, not the fastest.
Why is superelevation needed on a road curve?
A vehicle on a curve is pushed outward by centrifugal force. Superelevation tilts the road inward so part of the vehicle’s weight balances that force, reducing the friction the tyres must provide and keeping the vehicle stable.
What happens if superelevation is too much?
Fast vehicles are fine, but slow vehicles slide inward, and vehicles stopped on the curve can be dragged toward the centre. That is why the IRC maximum exists.
Does every curve need superelevation?
No. On a very flat curve the calculated superelevation can be less than the camber — then just provide camber. Superelevation is only needed where the curve is sharp enough to demand it.
What happens if superelevation is too little?
The tyres have to carry more of the centrifugal force through friction. If the required friction exceeds 0.15, the curve is unsafe in wet weather — increase the radius or lower the design speed.
Final Thoughts
Superelevation design is a short calculation with real safety consequences: one formula, one maximum, and one transition length to set out carefully. Get those three right and the curve looks after itself; get any of them wrong and the driver finds out first. If you are setting out a curve, also check the horizontal curve design guide for radius, sight distance and curve length.
Written by Mohsin Raza Adil — BSc Civil Engineering Technologist (NTC-registered), Pakistan.

Mohsin Raza Adil
BSc Civil Engineering Technologist (NTC-registered), Pakistan. I write practical, field-tested guides on construction materials, soil testing and site engineering — the way it is actually done on site.

2 thoughts on “Superelevation in Roads: Design, Formula, Worked Example”