Every specification for earthwork says something like “compact to 95% of maximum dry density”. But where does that maximum come from? It comes from the laboratory — from the Proctor compaction test, which finds the moisture content at which a soil compacts to its densest possible state.
The two outputs of the test are the maximum dry density (MDD) and the optimum moisture content (OMC). Understand them, and the whole system of compaction control — field density tests, relative compaction, moisture conditioning — falls into place.
What the Test Determines
Soil compacts best at a particular water content. Too dry, and friction between particles resists compaction. Too wet, and water fills the voids — and since water is incompressible, the particles cannot pack any tighter. Between those extremes lies a sweet spot: the optimum moisture content, where the soil reaches its maximum dry density.
The Proctor test finds this point by compacting several soil samples at different moisture contents with a fixed compactive effort, measuring the dry density of each, and plotting dry density against moisture content. The peak of the resulting curve gives MDD and OMC.
Standard Proctor vs Modified Proctor
There are two versions of the test, differing in compactive effort:
| Item | Standard Proctor (ASTM D698) | Modified Proctor (ASTM D1557) |
|---|---|---|
| Hammer weight | 2.5 kg (5.5 lb) | 4.5 kg (10 lb) |
| Drop height | 305 mm (12 in) | 457 mm (18 in) |
| Layers | 3 | 5 |
| Blows per layer (100 mm / 4-in mould) | 25 | 25 |
| Compactive effort | ~600 kN·m/m³ (12,400 ft·lbf/ft³) | ~2,700 kN·m/m³ (56,000 ft·lbf/ft³) |
| Typical use | Light fills, subgrades under light loads | Heavy-duty pavements, airfields, heavy structures |
The Modified Proctor delivers about 4.5 times the energy of the Standard test. Higher energy shifts the curve: the Modified MDD is higher and its OMC is lower than the Standard values for the same soil.
Reading the Moisture–Density Curve
The plotted curve has a characteristic shape:
- Dry of optimum (left side): dry density rises as water is added — water lubricates the particles, letting them slide into a denser packing.
- The peak: the highest point of the curve. Its y-value is the maximum dry density (MDD); its x-value is the optimum moisture content (OMC).
- Wet of optimum (right side): dry density falls as more water is added — the voids are increasingly filled with incompressible water instead of soil particles.
Typical ranges (for orientation only — every soil differs):
| Soil type | MDD (kg/m³) | OMC (%) |
|---|---|---|
| Well-graded sand/gravel | 2000 – 2200 | 8 – 12 |
| Silty sand | 1900 – 2100 | 10 – 14 |
| Clayey soil | 1750 – 2000 | 14 – 20 |
| Heavy clay | 1600 – 1850 | 18 – 25 |
Worked Example: Computing Dry Density from a Trial Point
The core calculation in the test converts each compacted sample’s wet (bulk) density to dry density:
γd = γ / (1 + w)
where γ is the bulk (wet) density and w is the moisture content as a decimal.
Given: A trial compacted in the 944 cm³ (1/30 ft³) mould.
- Weight of mould + compacted soil = 4,185 g
- Weight of empty mould = 2,010 g
- Moisture content of the sample, w = 12.0% = 0.12
Step 1 — Weight of soil:
4,185 − 2,010 = 2,175 g
Step 2 — Bulk density:
γ = 2,175 g ÷ 944 cm³ = 2.304 g/cm³ = 2,304 kg/m³
Step 3 — Dry density:
γd = 2,304 ÷ (1 + 0.12) = 2,304 ÷ 1.12 = 2,057 kg/m³
This gives one point on the curve: (w = 12.0%, γd = 2057 kg/m³). Repeat at 4–6 moisture contents, plot, and read the peak.
Why OMC Matters on Site
The laboratory values are not academic — they directly control site work:
- Moisture conditioning: before rolling, the fill must be brought close to OMC. Too dry? Add water and mix. Too wet? Aerate and let it dry.
- Compaction acceptance: every field density test compares the field dry density against the laboratory MDD.
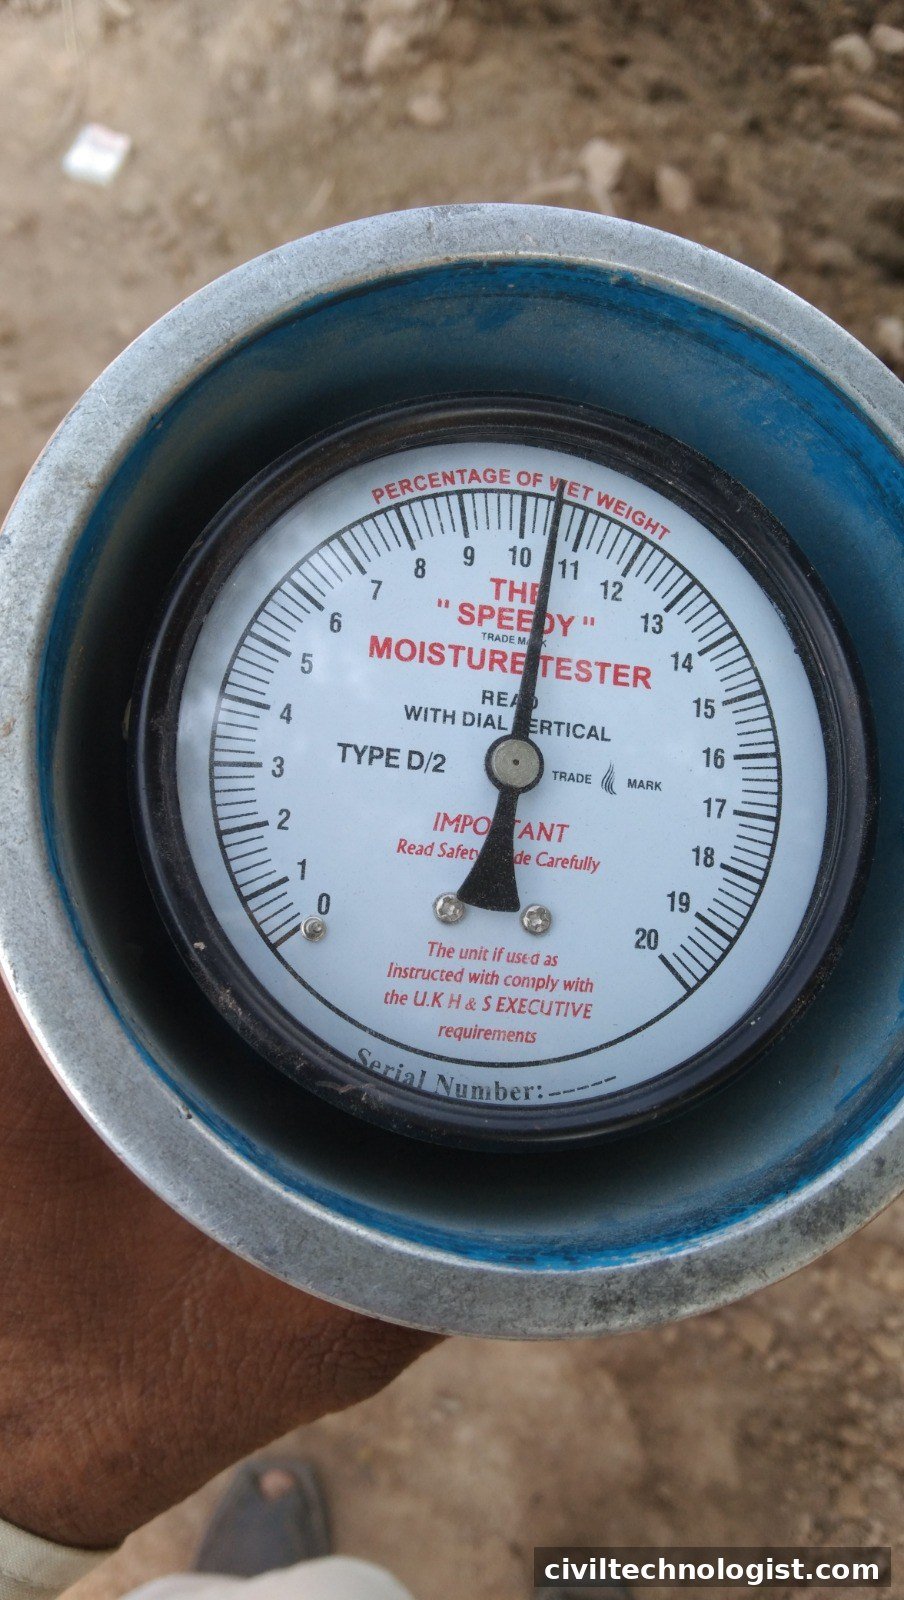
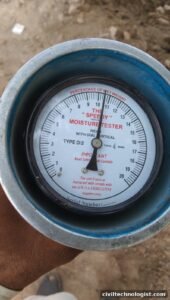
- Rapid moisture checks: on site, moisture is often checked with a Speedy moisture tester (calcium carbide method).
- CBR testing: California Bearing Ratio specimens are compacted at OMC, so the Proctor result feeds directly into pavement design as well.
Common Mistakes
- Using the wrong MDD — comparing field results against a Modified Proctor MDD when the specification calls for Standard (or vice versa).
- Testing the wrong material — the lab sample must represent the fill actually being placed. A new borrow source means a new Proctor test.
- Chasing density at the wrong moisture — extra roller passes on dry-of-optimum soil give diminishing returns. Water first, then roll.
Frequently Asked Questions
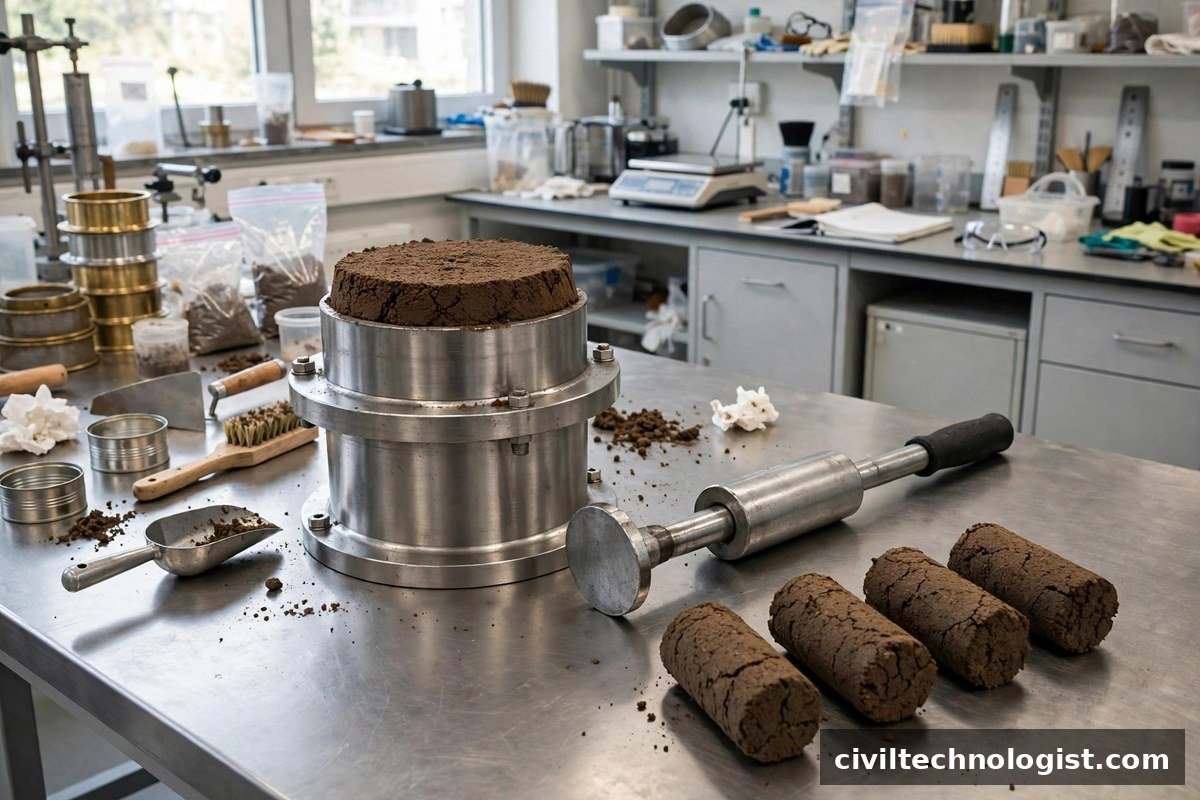
Compactive effort. Standard (ASTM D698) uses a 2.5 kg hammer, 305 mm drop, 3 layers × 25 blows (~600 kN·m/m³). Modified (ASTM D1557) uses a 4.5 kg hammer, 457 mm drop, 5 layers × 25 blows (~2,700 kN·m/m³) — about 4.5 times the energy.
What is optimum moisture content in simple terms?
The water content at which a soil can be compacted to its maximum dry density with a given compactive effort. It is read from the peak of the moisture–density curve.
Why does dry density decrease after OMC?
Beyond OMC, additional water occupies void space that soil particles could otherwise fill. Since water cannot be compressed, the solid particles are held further apart and dry density falls.
How is MDD used in the field?
Field dry density from sand cone or core cutter tests is expressed as a percentage of the laboratory MDD (“relative compaction”). Specifications typically require 90–98% depending on the layer and loading.
Final Thoughts
The Proctor test is nearly a century old (R. R. Proctor, 1933) and still the backbone of earthwork quality control — because the question it answers never changes: how dense can this soil get, and how wet should it be when we try? Get the MDD and OMC right in the lab, hold the moisture near OMC on site, and the field density tests take care of themselves.
Written by Mohsin Raza Adil — BSc Civil Engineering Technologist (NTC-registered), Pakistan.

Mohsin Raza Adil
BSc Civil Engineering Technologist (NTC-registered), Pakistan. I write practical, field-tested guides on construction materials, soil testing and site engineering — the way it is actually done on site.
2 thoughts on “Maximum Dry Density & Optimum Moisture Content: Proctor Test Explained”