Buildings on clay do not settle the day the last floor is cast. They settle slowly — over months and years — as water is squeezed out of the soil pores under the building’s weight. The consolidation test (oedometer test) is the laboratory test that predicts how much a clay layer will settle and how long it will take.
This guide covers what consolidation really is, how the oedometer test is run, how to read the e–log p curve, and how to turn the results into an actual settlement number with worked examples.
Consolidation vs Compaction — Don’t Mix Them Up
These two words sound similar but describe completely different processes:
| Compaction | Consolidation | |
|---|---|---|
| What is expelled | Air from the pores | Water from the pores |
| How it happens | Mechanical effort (rollers, rammers) | Sustained static load over time |
| Time scale | Immediate — during construction | Slow — months to years |
| Applies to | Mostly unsaturated fill placed in layers | Saturated fine-grained soils (clays, silts) |
| Controlled by | Compactive effort and moisture content | Permeability and drainage path length |
A useful way to remember: compaction is something we do to soil on purpose to improve it; consolidation is something soil does to us after we load it — and we must predict it so buildings don’t settle excessively.
What the Oedometer Test Does
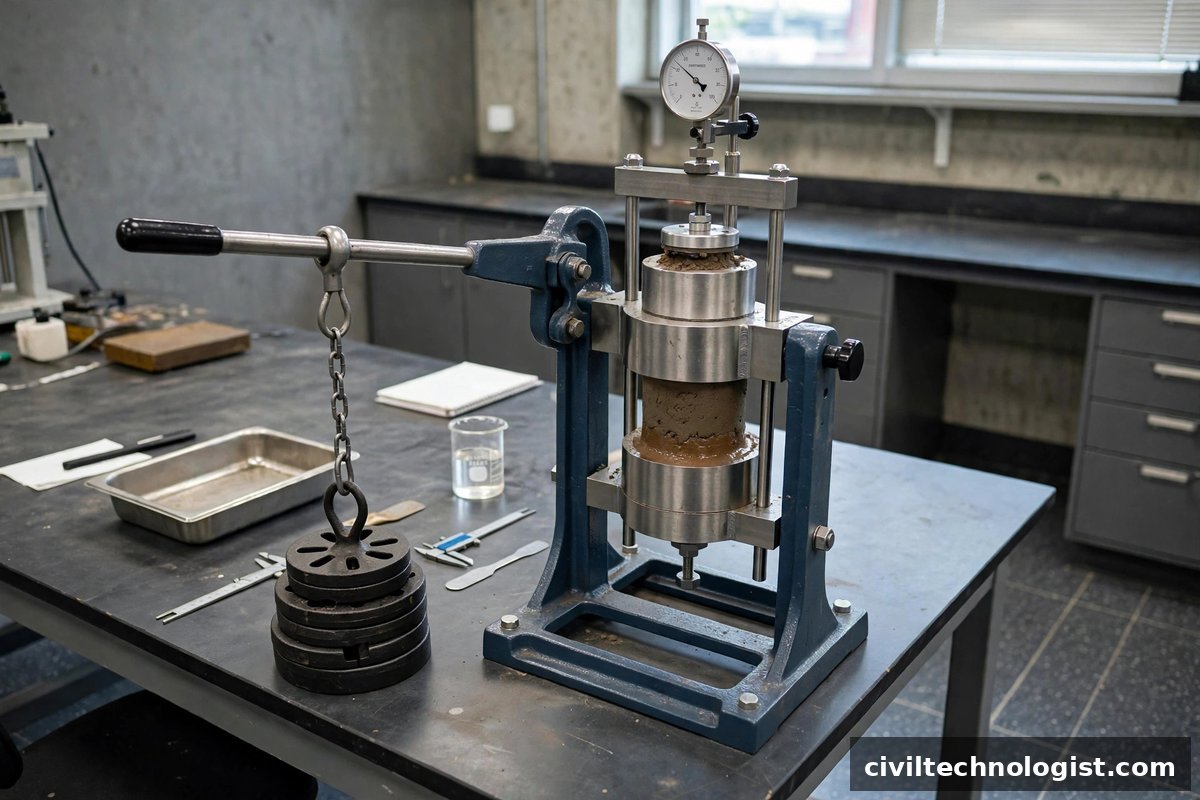
In the test, a saturated soil specimen is confined in a rigid metal ring (so it can only compress vertically — one-dimensional strain) and loaded in steps. After each load increment, the specimen’s vertical deformation is recorded against time until it stabilizes. From this data we determine:
- Compression index (Cc) — how compressible the soil is (magnitude of settlement).
- Coefficient of consolidation (Cv) — how fast settlement happens (rate of settlement).
- Preconsolidation pressure (σ’c) — the maximum past pressure the soil has experienced (its “stress memory”).
- Coefficient of volume compressibility (mv) and coefficient of compressibility (av) — derived parameters used in some settlement formulations.
These feed directly into foundation settlement calculations for buildings, embankments, and tanks on clayey ground.
Governing Standards
- ASTM D2435 — Standard test methods for one-dimensional consolidation properties of soils using incremental loading.
- AASHTO T 216 — One-dimensional consolidation properties of soils (the AASHTO equivalent).
Apparatus
- Oedometer (consolidometer) — a rigid confining ring holding the specimen (commonly 63.5 mm or 75 mm diameter, 25 mm or 20 mm high), seated between two porous stones inside a water-filled cell.
- Loading device — a lever-arm or pneumatic system that applies vertical load increments; the load increment ratio is normally 1 (each step doubles the pressure).
- Dial gauge or displacement transducer — reads vertical deformation to 0.002 mm or better.
- Balance, oven, and trimming tools — for specimen preparation, water content, and specific gravity determination.
The specimen must be as undisturbed as possible — a disturbed sample loses its stress history, and the preconsolidation pressure you measure will be meaningless. Trim it carefully into the ring with minimum handling.
Test Procedure (Step by Step)
- Prepare the specimen. Trim an undisturbed sample into the consolidation ring, place porous stones above and below it, and assemble the cell. Flood the cell with water so the specimen stays saturated throughout.
- Apply a small seating load (typically around 5–10 kPa) and record the initial dial reading.
- Load in increments. Apply the first load increment and start the timer. Record dial readings on a schedule — e.g. 0.1, 0.25, 0.5, 1, 2, 4, 8, 15, 30, 60 minutes, then 2, 4, 8, and 24 hours.
- Maintain each increment for 24 hours (or until the deformation rate becomes negligible), then double the load. A typical sequence: 25 → 50 → 100 → 200 → 400 → 800 → 1600 kPa.
- Unload and reload. After the maximum load, unload in decrements (often to one-quarter of maximum, then reload) to capture the rebound/recompression behavior.
- Dismantle and weigh. At the end, remove the specimen, determine its final water content, and compute the void ratio at each load stage from the deformation readings.
Practical note: The maximum applied pressure should comfortably exceed the expected preconsolidation pressure — guidance in ASTM D2435 practice is to reach at least several times the estimated in-situ overburden stress, so that the virgin compression line is well defined. If you stop loading too early, the e–log p curve never straightens out and Cc cannot be read reliably.
The e–log p Curve
For each load increment, compute the void ratio (e) at the end of the increment and plot it against the logarithm of the applied vertical effective pressure (p or σ’). The resulting e–log p curve has three recognizable parts:
- Recompression curve — the initial flat portion, where the soil is being reloaded below its past maximum stress. Small deformations.
- Virgin compression line — the steep, straight portion at higher pressures, where the soil is being compressed beyond anything it has experienced before. Its slope gives Cc.
- Rebound curve — the flatter curve traced during unloading; its slope gives the recompression/swell index (Cr or Cs).
Finding the preconsolidation pressure (Casagrande’s method)
- On the e–log p curve, locate the point of maximum curvature (where the curve bends most sharply).
- Draw a horizontal line through that point.
- Draw a tangent to the curve at that point.
- Bisect the angle between the horizontal line and the tangent.
- Extend the straight virgin compression portion backward until it meets the bisector — the pressure at that intersection is the preconsolidation pressure σ’c.
Compare σ’c with the current in-situ effective overburden stress (σ’v0):
- σ’c ≈ σ’v0 → normally consolidated (NC) — the soil is at its historical maximum stress.
- σ’c > σ’v0 → overconsolidated (OC) — the soil was once loaded more heavily (by eroded overburden, glaciers, or desiccation). The overconsolidation ratio OCR = σ’c / σ’v0.
- σ’c < σ’v0 → underconsolidated — still consolidating under its own weight (young fills, recent deposits).
Key Parameters and Worked Examples
Compression index, Cc
Cc is the slope of the virgin compression line:
Cc = (e₁ − e₂) / log₁₀(p₂ / p₁)
Worked example: On the virgin portion of an e–log p curve, the void ratio is e₁ = 0.92 at p₁ = 100 kPa and e₂ = 0.74 at p₂ = 400 kPa.
Cc = (0.92 − 0.74) / log₁₀(400 / 100) = 0.18 / log₁₀(4) = 0.18 / 0.6021 = 0.30
Typical Cc values: 0.1–0.3 for stiff clays, 0.3–0.5 for medium clays, and 0.5–1.0+ for soft, highly plastic clays. As a rough check, Skempton’s correlation Cc ≈ 0.007 × (LL − 10) ties it to the liquid limit.
Coefficient of consolidation, Cv
Cv describes the rate of consolidation and comes from the time–deformation readings of each increment, using either:
- Log-time method (Casagrande): plot dial reading vs log of time, find t₅₀ (time for 50% consolidation), then Cv = 0.197 · H²dr / t₅₀
- Root-time method (Taylor): plot dial reading vs √time, find t₉₀, then Cv = 0.848 · H²dr / t₉₀
where Hdr is the drainage path (half the specimen thickness for double drainage).
Worked example (log-time method): For one load increment, t₅₀ = 12 minutes = 720 s. The specimen thickness at 50% consolidation is 20 mm, with drainage top and bottom, so Hdr = 10 mm.
Cv = 0.197 × (10 mm)² / 720 s = 0.197 × 100 / 720 = 0.0274 mm²/s
Convert to m²/year: 0.0274 mm²/s × 31.56 × 10⁶ s/yr ÷ 10⁶ mm²/m² = 0.86 m²/yr — a very typical value for a medium clay (usual range roughly 0.5–5 m²/yr for clays).
Settlement calculation — the number that matters
For a normally consolidated clay layer, primary consolidation settlement is:
s_c = H₀ · [Cc / (1 + e₀)] · log₁₀((σ’v0 + Δσ’) / σ’v0)
where H₀ is the layer thickness, e₀ the initial void ratio, σ’v0 the initial vertical effective stress at the layer’s midpoint, and Δσ’ the average added vertical stress from the new load.
Worked example: A 6 m thick normally consolidated clay layer has e₀ = 0.90 and Cc = 0.30 (from the lab test above). The effective overburden stress at mid-layer is σ’v0 = 80 kPa, and a new building adds an average Δσ’ = 60 kPa at that depth.
s_c = 6 × [0.30 / (1 + 0.90)] × log₁₀((80 + 60) / 80)
s_c = 6 × (0.30 / 1.90) × log₁₀(1.75)
s_c = 6 × 0.1579 × 0.2430 = 0.230 m ≈ 230 mm
Interpretation: 230 mm of long-term settlement is significant — most buildings tolerate only 25–65 mm of total settlement. A result like this is exactly what pushes a designer toward a raft foundation, preloading/surcharge with vertical drains, or piles. That is the real value of the test: it turns an invisible, years-long process into a number you can design against.
Practical note: For overconsolidated clays where the final stress stays below σ’c, settlement is much smaller and is computed with the recompression index Cr instead of Cc — one more reason the Casagrande construction matters.
Common Errors to Avoid
- Testing a disturbed sample — destroys the stress history; σ’c and OCR become fiction.
- Stopping the load sequence too early — the virgin line never develops, so Cc is unreadable.
- Letting the specimen dry out — the cell must stay flooded; desiccation during the test ruins the results.
- Reading dial gauges on a wobbly bench — vibration shows up as noise in the time curves; use a stable, isolated table.
- Ignoring secondary compression — in soft clays and organic soils, creep after the end of primary consolidation can add meaningful settlement.
Frequently Asked Questions
What is the difference between consolidation and compaction?
Compaction expels air from soil pores by mechanical effort and happens immediately during construction. Consolidation expels water from saturated fine-grained soils under sustained load and happens slowly over months or years.
What does the oedometer test measure?
It measures one-dimensional consolidation properties: the compression index Cc (magnitude of settlement), the coefficient of consolidation Cv (rate of settlement), the preconsolidation pressure σ’c (stress history), and derived parameters mv and av.
How long does a consolidation test take?
With 24-hour load increments across 6–8 loading steps plus unloading, a full test typically takes 1–2 weeks. Shorter increments are sometimes used, but 24 hours per step is the standard reference.
What is preconsolidation pressure in simple terms?
It is the maximum effective stress the soil has ever experienced — the soil’s “memory” of past loading. It tells you whether the ground is normally consolidated or overconsolidated, which completely changes the settlement calculation.
Final Thoughts
The consolidation test is slow, fussy laboratory work — and one of the highest-value tests in geotechnical engineering. A week of careful oedometer testing can be the difference between a building that settles 20 mm and one that settles 200 mm. Run it on truly undisturbed samples, load far enough to define the virgin line, and always carry the results through to an actual settlement number.
Written by Mohsin Raza Adil — BSc Civil Engineering Technologist (NTC-registered), Pakistan.

Mohsin Raza Adil
BSc Civil Engineering Technologist (NTC-registered), Pakistan. I write practical, field-tested guides on construction materials, soil testing and site engineering — the way it is actually done on site.
1 thought on “Consolidation Test (Oedometer): Procedure, e–log p Curve & Settlement Calculation”